TLDR
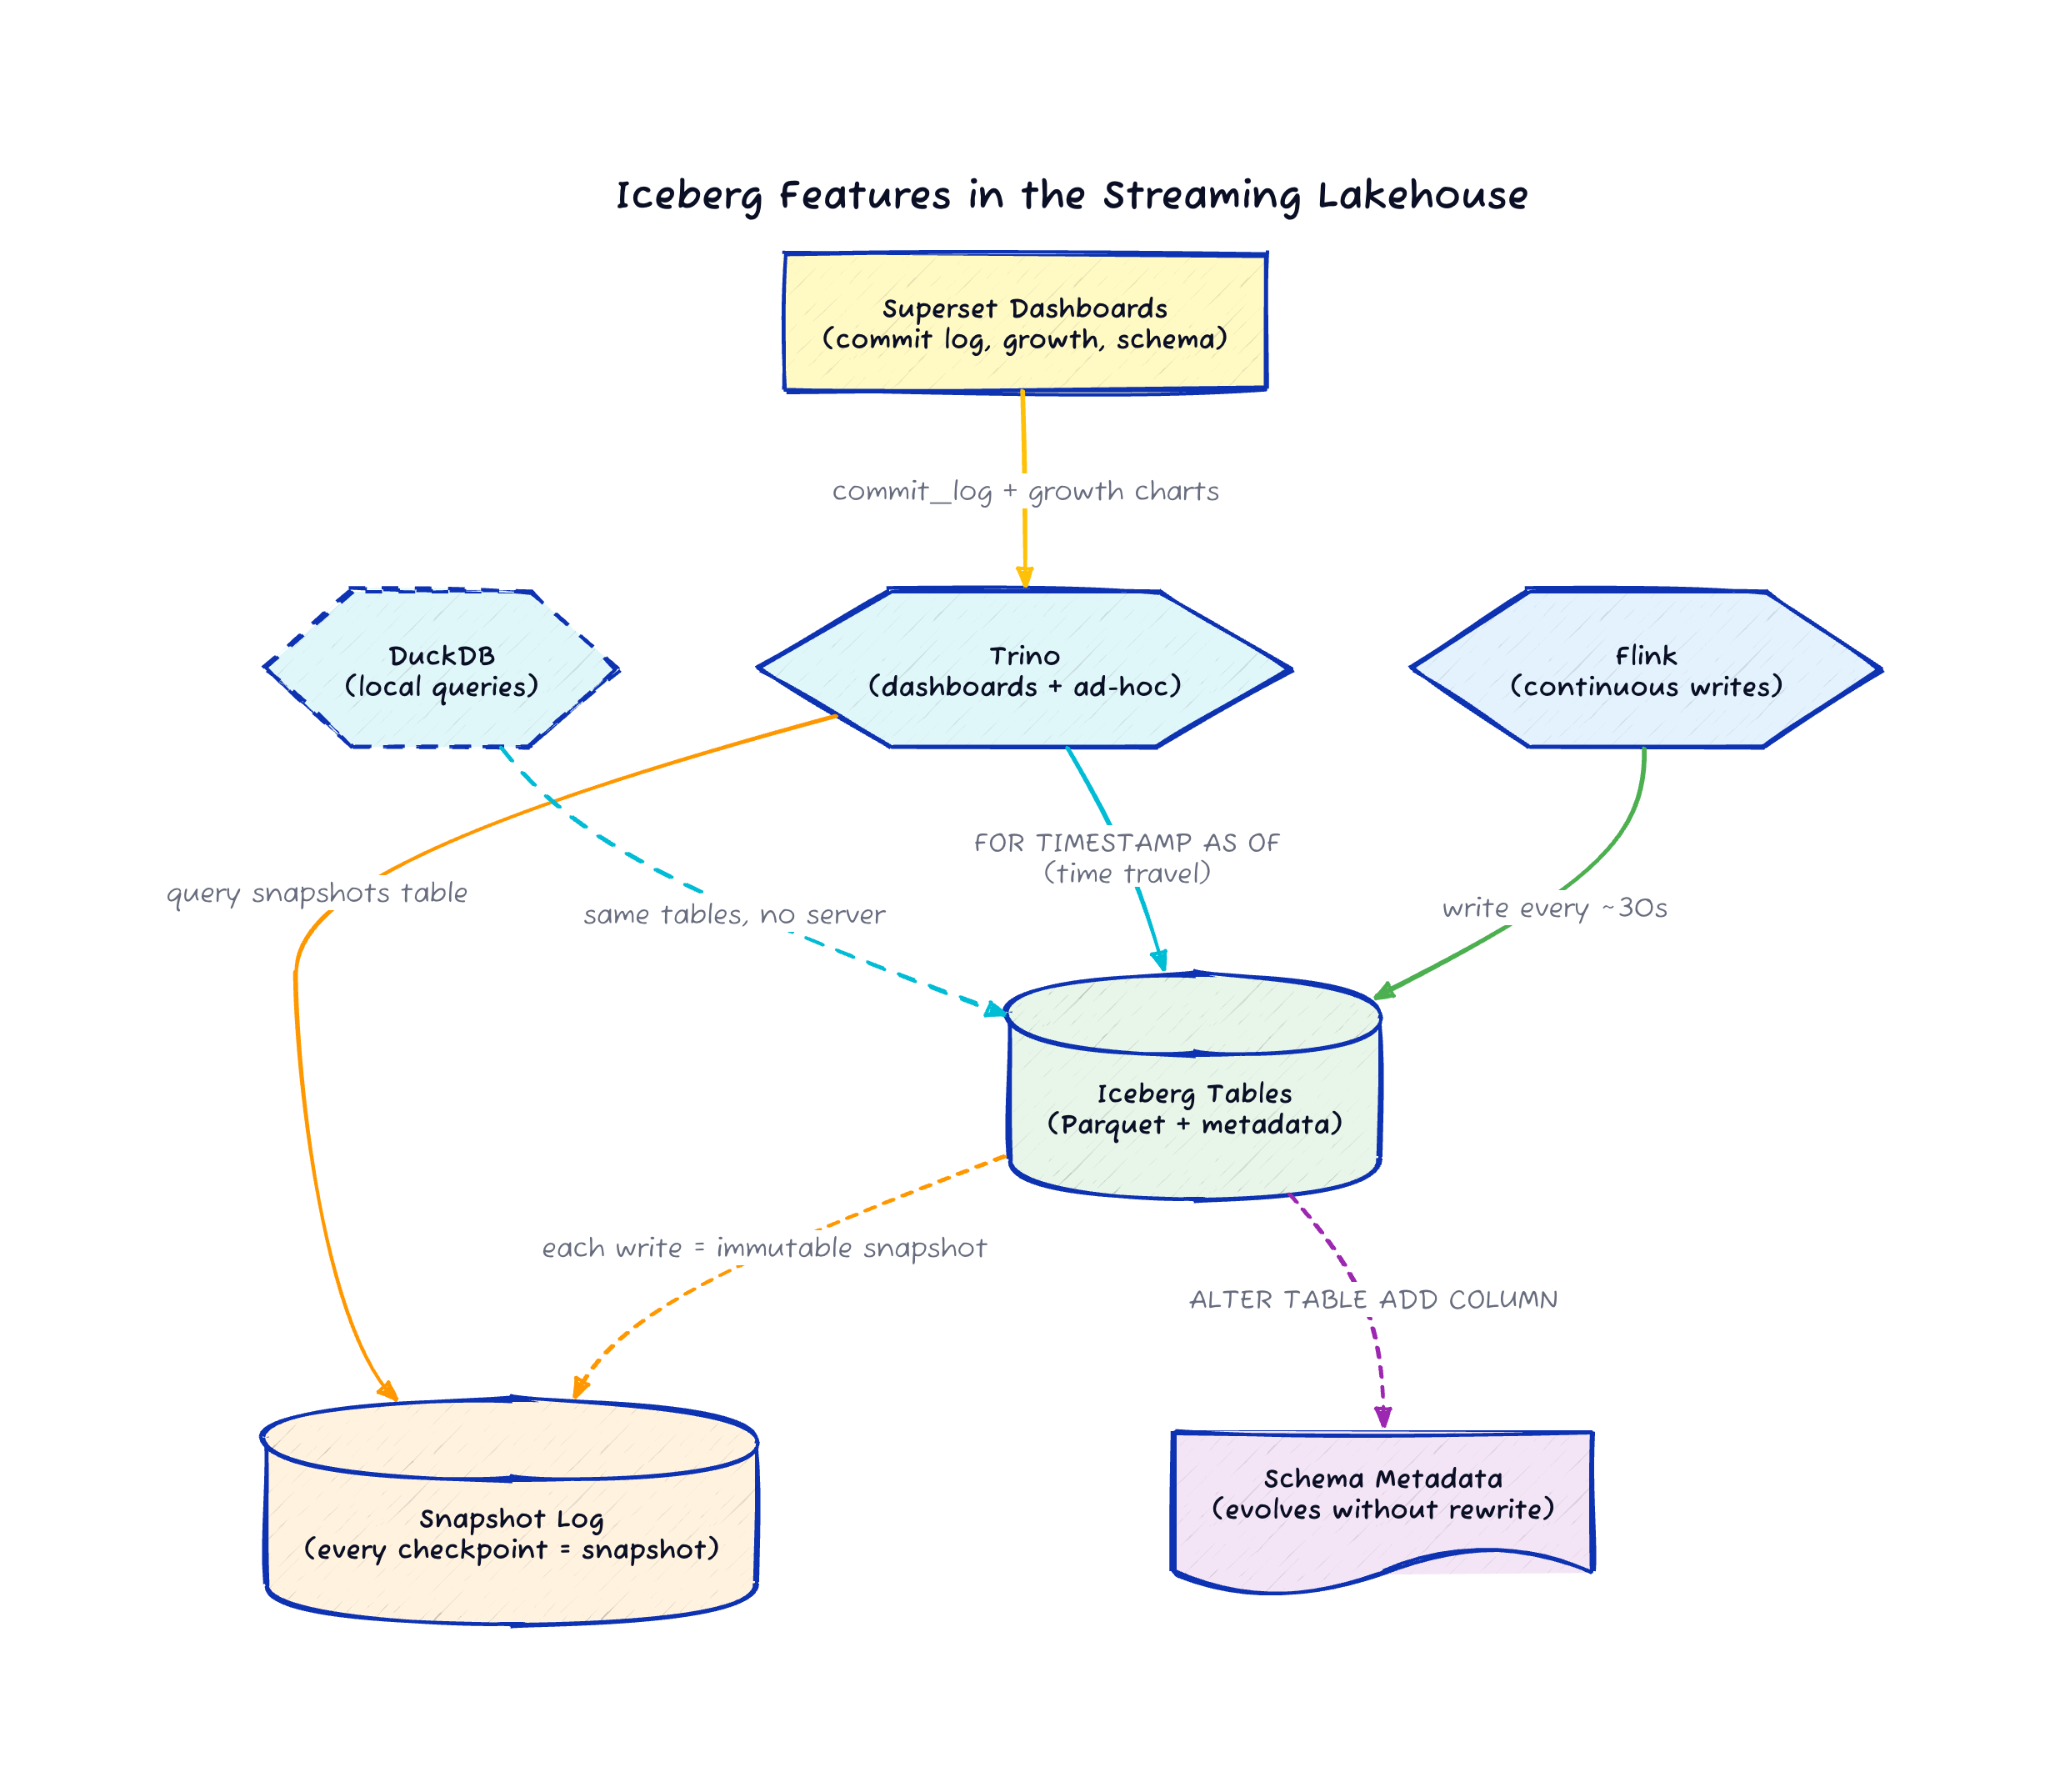
Iceberg tracks every Flink checkpoint as an immutable snapshot. That gives you time travel queries on a streaming pipeline for free, with about 30-second granularity.
You can add columns to a live Iceberg table while Flink is writing to it. Old rows get NULLs for the new columns, and the pipeline keeps running without rewriting data or taking downtime.
DuckDB reads the same Iceberg tables without Trino running. Three different query engines can hit the same data without copying anything.
The Pipeline Got Smarter
In the last post I built a streaming lakehouse with Kafka, Flink, Iceberg, Trino, and Superset, all running locally in Docker Compose.
The pipeline worked: events flowed in, Flink processed them, Iceberg stored them, Trino queried them, Superset visualized them.
One make demo command and you had the whole thing running.
But a pipeline that only moves data forward is half the story. I kept getting questions after that post: "Can I query what the data looked like an hour ago?" and "What happens when I need to add a field to the schema?" These are the questions that separate a demo from something you’d actually run in production.
So I added time travel, schema evolution, and a DuckDB integration to the same repo.
You can try all of it with make time-travel and make schema-evolution on the existing stack.
Time Travel: Every Checkpoint is a Snapshot
Iceberg tracks every commit as an immutable snapshot. In this pipeline, Flink commits at checkpoint boundaries, roughly every 30 seconds. Each of those commits becomes an Iceberg snapshot with a timestamp, an operation type, and a record count.
That means you can query what your data looked like at any point in the past, down to the checkpoint interval:
SELECT COUNT(*), AVG(reading)
FROM iceberg.warehouse.sensor_data
FOR TIMESTAMP AS OF (current_timestamp - interval '10' minute);
You can also browse the snapshot history itself:
SELECT snapshot_id, committed_at, operation
FROM iceberg.warehouse."sensor_data$snapshots"
ORDER BY committed_at DESC;
And if you have a specific snapshot ID from the log, you can query that exact version:
SELECT * FROM iceberg.warehouse.user_activity
FOR VERSION AS OF 1234567890;
To see this in action on the running pipeline, run:
make time-travelThis shows the available snapshots and compares the current record count against the count from five minutes ago. You can see exactly how much data Flink has written in that window.
Why This Matters for Streaming
Time travel on a batch table helps with auditing. On a streaming table, it becomes a debugging tool. When your Flink job produces unexpected results at 3 AM, you want to see what the data looked like before and after the problem started. With Iceberg snapshots at 30-second granularity, you can narrow down when the data changed without digging through Kafka offsets or replaying the stream.
I built a Superset dashboard view that turns the snapshot log into a commit timeline:
CREATE OR REPLACE VIEW iceberg.warehouse.iceberg_commit_log AS
SELECT
    snapshot_id,
    committed_at,
    operation,
    TRY_CAST(summary['added-records'] AS BIGINT) AS added_records,
    TRY_CAST(summary['total-records'] AS BIGINT) AS total_records,
    TRY_CAST(summary['added-data-files'] AS INTEGER) AS added_files
FROM iceberg.warehouse."sensor_data$snapshots";
Superset renders this as a line chart showing data growth over time. Every Flink checkpoint commit shows up as a data point, so you can see the write rate, spot gaps, and correlate drops with job restarts.
Schema Evolution: Add a Column to a Running Pipeline
Iceberg supports adding columns without rewriting existing data. Old rows return NULL for the new columns, and new rows fill them in. This works while Flink is actively writing to the table.
Here is the schema evolution demo running through Trino:
ALTER TABLE iceberg.warehouse.sensor_data
ADD COLUMN IF NOT EXISTS alert_threshold DOUBLE;

ALTER TABLE iceberg.warehouse.user_activity
ADD COLUMN IF NOT EXISTS device_type VARCHAR;
After running these statements, existing rows in sensor_data have alert_threshold = NULL, and new rows written by Flink can populate the field if the data generator includes it.
The Flink job keeps writing, the Parquet files stay untouched, and the pipeline never goes down.
To run the demo:
make schema-evolutionWhat This Looks Like in Practice
I created a Superset view that projects the evolved columns alongside the original ones:
CREATE OR REPLACE VIEW iceberg.warehouse.sensor_schema_evolution AS
SELECT sensor_id, sensor_type, event_time, reading, unit, alert_threshold
FROM iceberg.warehouse.sensor_data;
In the Superset table chart, you can see the boundary between old and new data.
Rows written before the ALTER TABLE show NULL in the alert_threshold column.
Rows written after show the actual value.
That visual boundary is proof that the schema changed in place without any data rewrite.
This is one of Iceberg’s strongest selling points for streaming pipelines. In a traditional data warehouse, a schema change means a maintenance window. In an Iceberg-backed streaming lakehouse, it means running one SQL statement while the pipeline keeps writing.
DuckDB: Same Tables, No Server
The original post used Trino as the query engine because Superset needs a SQL server to connect to. But the Iceberg tables themselves are just Parquet files managed by a REST catalog. Any engine that speaks Iceberg can read them.
DuckDB with the Iceberg extension connects directly to the same REST catalog and SeaweedFS storage. No Trino process required:
uv pip install duckdb
make duckdb
The DuckDB script runs aggregations over both the sensor and user activity datasets, connecting directly to the Iceberg REST catalog and SeaweedFS. This proves a point that matters for the lakehouse architecture: Flink writes the data, Trino serves the dashboards, and DuckDB handles local ad-hoc analysis. Three engines, one copy of the data.
If you’re exploring data in a notebook or running a quick check from the command line, DuckDB is faster to start than firing up a Trino coordinator. The Iceberg format is what makes this flexibility possible. The data doesn’t belong to any single engine.
Three New Superset Dashboards
The original post had hourly aggregation views. I added three Iceberg-specific dashboard panels:
The Iceberg commit log table shows every Flink checkpoint commit as an Iceberg snapshot with timestamp, operation type, records added, and a running total
A data growth line chart tracks the total record count over time, with data points at roughly 30-second intervals matching the Flink checkpoint cadence
A schema evolution table displays sensor readings including the evolved
alert_thresholdcolumn, with NULLs visible for pre-evolution rows
These views help you understand what the pipeline is doing at the storage layer, which is information most streaming dashboards miss entirely.
The Bigger Picture
When I chose Iceberg for this stack, I said it was because Confluent’s Tableflow writes Iceberg tables, so the open-source version should match the format. That’s true, but the real reason Iceberg earned its place is what you get after the data lands.
Time travel turns your streaming pipeline into an auditable system. Schema evolution means your data model can grow without maintenance windows. And because the data sits in an open format, a single developer with DuckDB on their laptop can query the same tables that Superset uses for production dashboards.
These are the features that move a streaming pipeline from "it works" to "I trust it." And they all came from the table format, not the processing engine.
Try It
If you ran the original pipeline, pull the latest from the repo and try the new targets:
git pull
make demo
make time-travel
make schema-evolution
make duckdb
The repo is at github.com/gAmUssA/flink-trino-superset-pipeline. If you hit issues or have ideas for the next round of features, open a GitHub issue.